RDM modelling
S(2-theta) = Icoh(2-theta)/<f2>.
The ideal situation is to start from a crystal structure presenting exactly the glass composition. The cell volume may be adjusted for corresponding to the measured glass density. A preliminary test consists in looking at the starting agreement between observed and calculated S(2-theta) selecting some standard line broadening parameters (they can be easily adjusted by hand) and refining the scale factors. In case of non ideal composition, for instance modelling a NaPbFe2F9 glass starting from coordinates of KCaAl2F9, after cell adaptation, the best would be to refine first the F atom coordinates, expecting adjustment of Pb-F (~2.50 Å), Na-F (~2.35 Å) and Fe-F (~1.93 Å) distances replacing respectively the K-F (~2.80 Å), Ca-F (~2.40 Å) and Al-F (~1.81 Å) ones (one should try Pb/Na permutation too and also some statistical disorder). The next step, if some convergence has been obtained, is to refine all atomic coordinates. This supposes that a maximum of independent diffraction data have been collected. The RDM program ARITVE is limited to 75 refinable coordinates. Trying a model with this complexity would require the largest possible number of oscillations on diffraction data, say at least a total of 25 bumps which could correspond to 3 independent structure factors exhibiting 8 or 9 oscillations each of them. Finally, the line-broadening parameters could be refined and even the cell parameters. The process converges, or not, with agreement factors depending on the model.
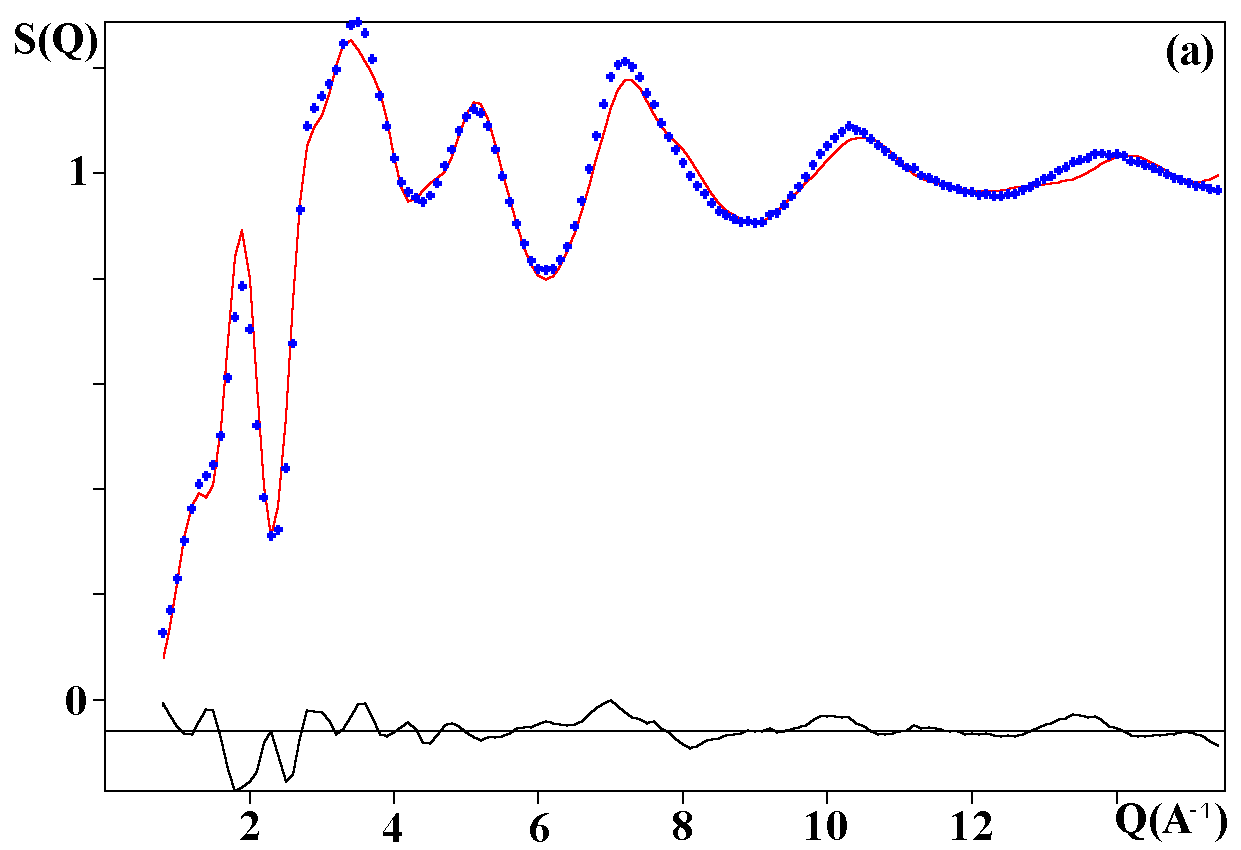
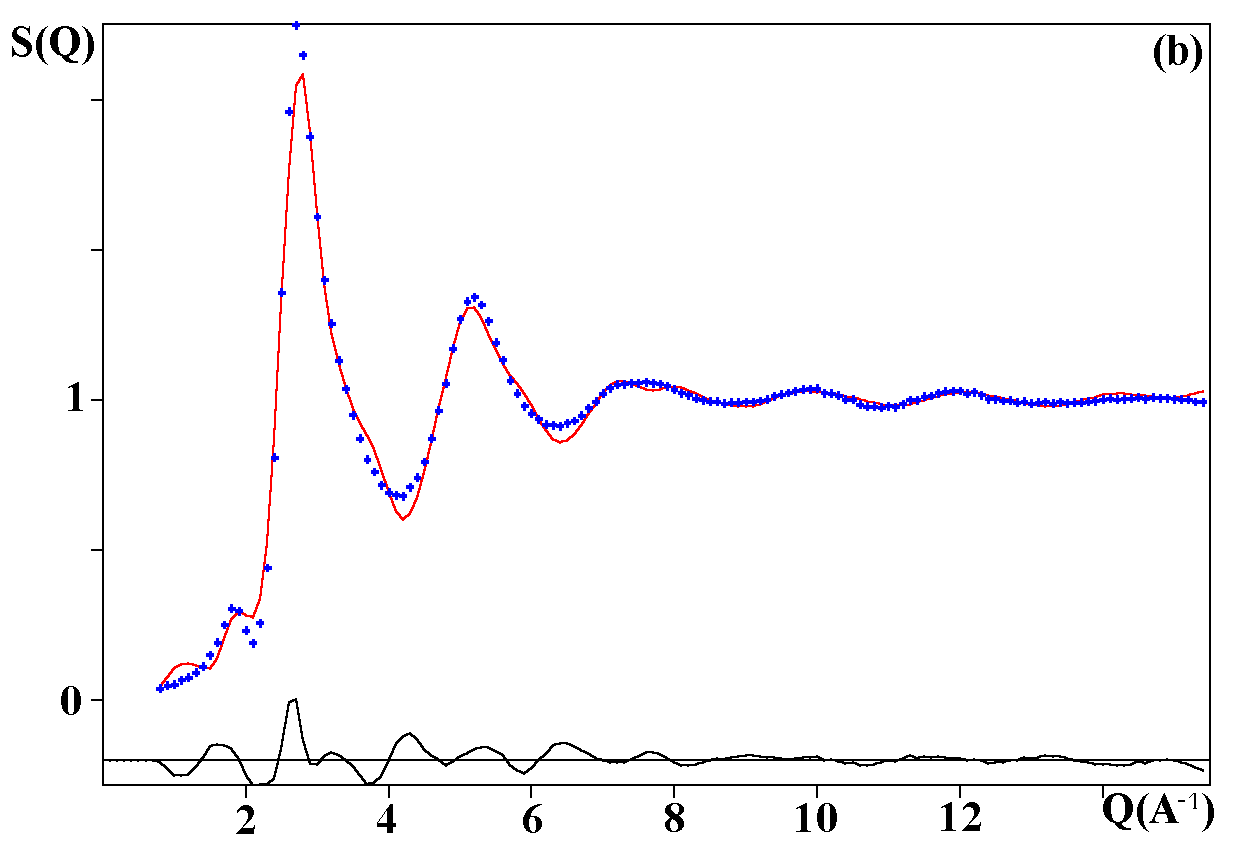
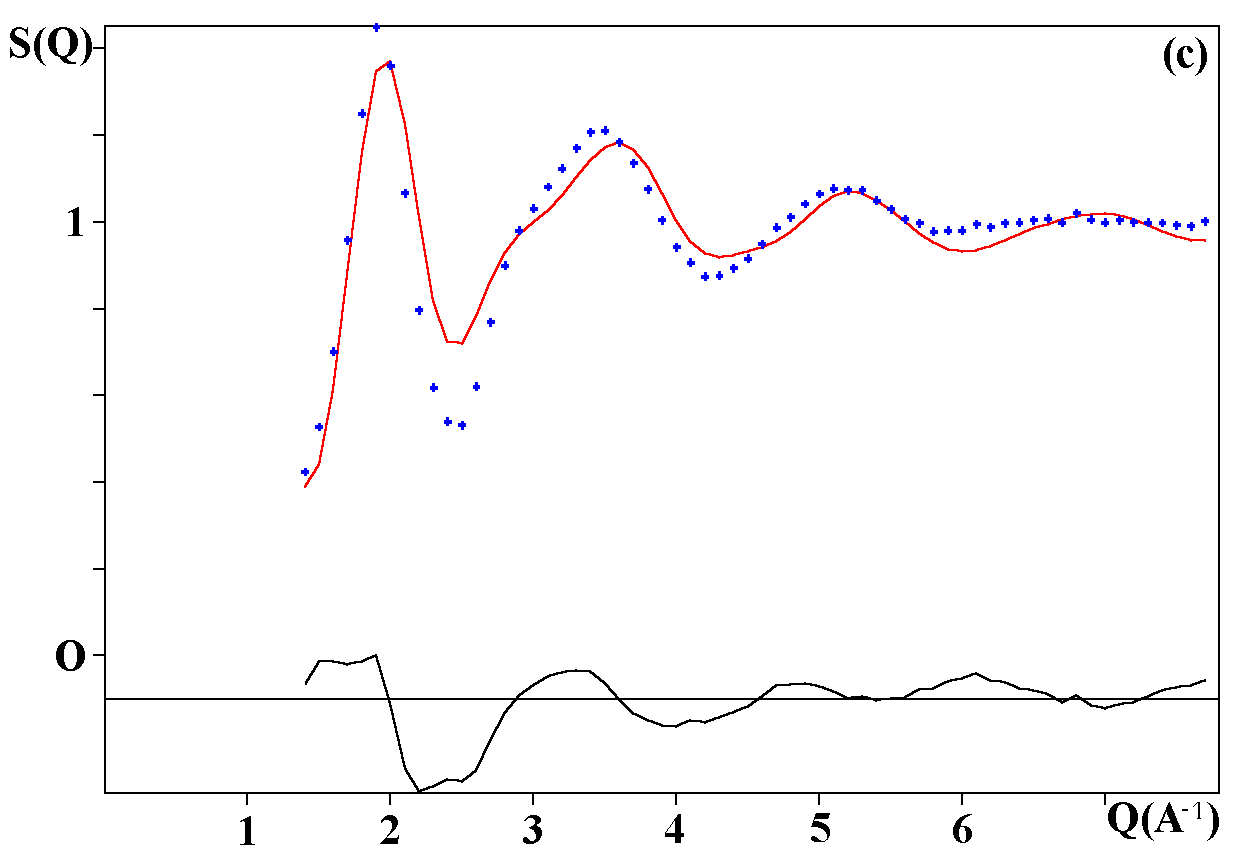
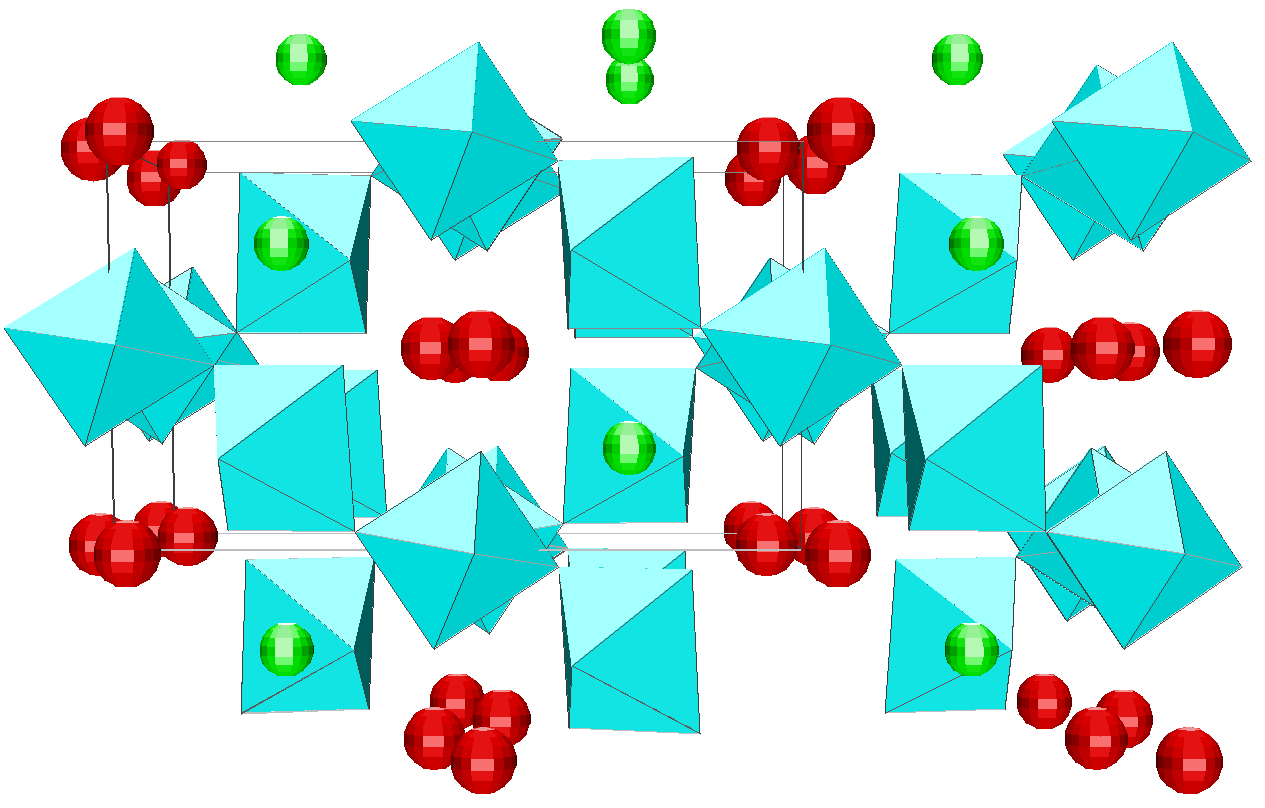
Depending on the initial model tested, these strategies were applied for modelling the title materials. Usually, both the neutron patterns with M = Fe and V were fitted first simultaneously up to some agreement (in the range 4-120°). Then the X-ray data were added and it was generally observed that the previous agreement factor R on the neutron data increased before to reach a new equilibrium value whereas that for the X-ray decreased. In the present case, the X-ray data are highly depending on atom pairs involving the Pb atom (mainly Pb-F and Pb-Pb pairs) whereas the F-F contribution is dominant for both neutron data together with that of the Fe-F pair for NaPbFe2F9. The contribution of the four partial structure factors involving the V atom (V-Na, V-Pb, V-V and V-F) is almost negligible on the NaPbV2F9 neutron data, explaining the large differences in the two neutron TSF. Calculations by the RDM method were on a PC Pentium 100Mhz, each model needed a few hours for being completed. At the stage of fitting the two neutron datasets only (M = Fe, V), it was concluded that most of the models were able to provide R factors smaller than 2 or 3% (Table II), as low as the RMC ones, even lower in a few cases. However adding the X-ray data made a difference between the RDM models with an advantage to those deriving from the crystalline forms of NaPbFe2F9 and KCaAl2F9 followed by the KPbCr2F9 and NaBaFe2F9 models. With a non exact composition, the Ba7CuFe6F34 and BaTiF5 models are not to be considered seriously but were able to produce fits of the experimental data as well as the two previous models, whereas the Ba2ZnAlF9 model gives a distinctly worst fit. In the early study of Pb2MIIMIIIF9 glasses by the RDM method [15], the KPbCr2F9 model was retained as the best, however most of the crystalline structures tested in the present study were unknown at this date. The best model as suggested by RDM is considered to be that deriving from the crystallized NaPbFe2F9 phase because of the lowest R factors obtained with the lowest number of x,y,z refined parameters, although the calculated density is 3% too high (Table II). The observed and calculated S(Q) curves are shown on the figure 3. A global view of the tridimensional octahedral network is shown on the figure 4. The starting and RDM-refined atomic coordinates are gathered in Table III.
|
Model |
R(%) |
R(%) |
N of xyz |
Reflection |
Cell volume |
Z |
|
NaPbFe2F9 |
1.87 Fe(N) |
2.00 Fe(N) 2.45 V(N) 5.07 Fe(RX) |
14 |
7484 |
705.5 |
4 |
|
KCaAl2F9 |
1.31 |
2.44 |
57 |
11878 |
2098.4 |
12 |
|
KPbCr2F9 |
1.53 |
2.09 |
23 |
7745 |
698.2 |
4 |
|
NaBaFe2F9 |
1.12 |
2.79 |
39 |
15721 |
732.6 |
4 |
|
Ba2ZnAlF9 |
2.45 |
4.13 |
23 |
8045 |
728.0 |
4 |
|
BaTiF5 |
1.40 |
1.68 |
27 |
8376 |
1527.7 |
16 |
|
Ba7CuFe6F34 |
1.13 |
2.58 |
37 |
15825 |
1456.2 |
2 |
Fig. 3. Experimental (dots) and RDM simulated (solid line) TSF of NaPbM2F9, (a) neutron data for M = Fe, (b) neutron data for M = V, (c) X-ray data for M = Fe. Model based on the NaPbFe2F9 crystal structure.


Fig. 4. Projection along the c axis of the RDM refined model for the NaPbM2F9 glasses (M = Fe, V). The starting model is that of the NaPbFe2F9 crystal structure. [MF6] octahedra are in blue (z = 0 or 1/2), Na atoms in green (z = 0 or 1/2) and Pb atoms in red (z = 1/4 or 3/4).

|
Atom |
Site |
x |
y |
z |
|
Na |
4c |
1/4 (1/4) |
1/4 (1/4) |
0 (0) |
|
Pb |
4e |
0 (0) |
0.044 (0.027) |
1/4 (1/4) |
|
Fe/V(1) |
4d |
1/4 (1/4) |
1/4 (1/4) |
1/2 (1/2) |
|
Fe/V(2) |
4b |
0 (0) |
1/2 (1/2) |
0 (0) |
|
F(1) |
8f |
0.257 (0.256) |
0.033 (0.041) |
0.947 (0.976) |
|
F(2) |
8f |
0.227 (0.207) |
0.169 (0.194) |
0.304 (0.280) |
|
F(3) |
8f |
0.046 (0.082) |
0.160 (0.153) |
0.576 (0.578) |
|
F(4) |
8f |
0.045 (0.039) |
0.353 (0.345) |
0.458 (0.463) |
|
F(5) |
4e |
0 (0) |
0.532 (0.527) |
1/4 (1/4) |
-/0/+
Armel Le Bail
- June 1997